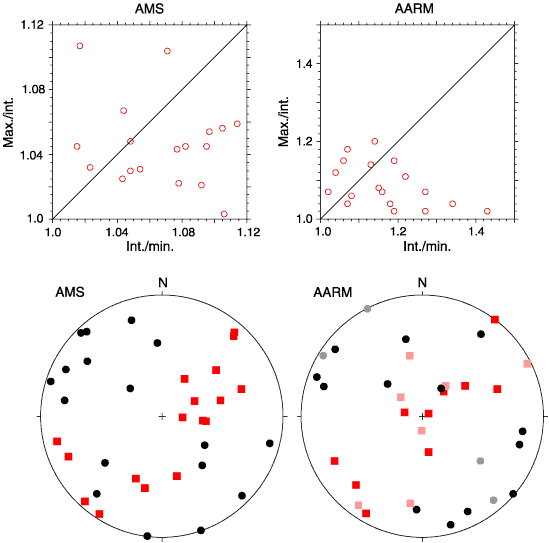
Figure F63. Anisotropy of magnetic susceptibility (AMS; left) and anisotropy of anhysteretic remanence (AARM; right) results for discrete samples from Hole 1274A. The Flinn-type diagrams (top) illustrate the shape and degree of anisotropy. Int./min. = intermediate/minimum eigenvalue ratio. Max./int. = maximum/intermediate eigenvalue ratio. Line separates fields for oblate (below line) and prolate (above line) fabrics. Lower plots show equal-area (lower hemisphere) projections of the AMS (left) and AARM (right) eigenvectors. Circles = eigenvector associated with the minimum eigenvalue. Squares = eigenvector associated with the maximum eigenvalue. For the AARM anisotropy plot, lighter circles = samples where the fabric is statistically prolate and lighter squares indicate samples with statistically oblate fabrics.


![]()