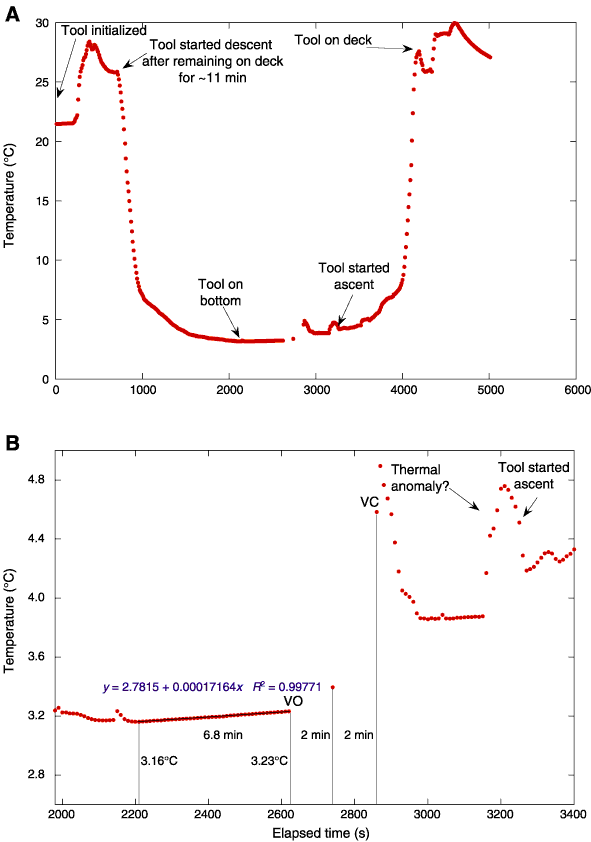
Figure F66. Temperature of ocean bottom water measured during the WSTP deployment prior to the beginning of drilling operations in Hole 1274A. A. Entire temperature time series showing the temperature response of the WSTP prior to, during, and after the deployment. B. Expanded section of the temperature changes while the WSTP was lowered to a depth of 2 m above seafloor. This profile shows the rising temperatures prior to collection of a water sample, the time when the water-sampling valve opened (VO), the time when the valve closed (VC), and a thermal anomaly after the valve closed. A linear fit to the temperature time-series data before the water-sampling valve opened is also shown.


![]()