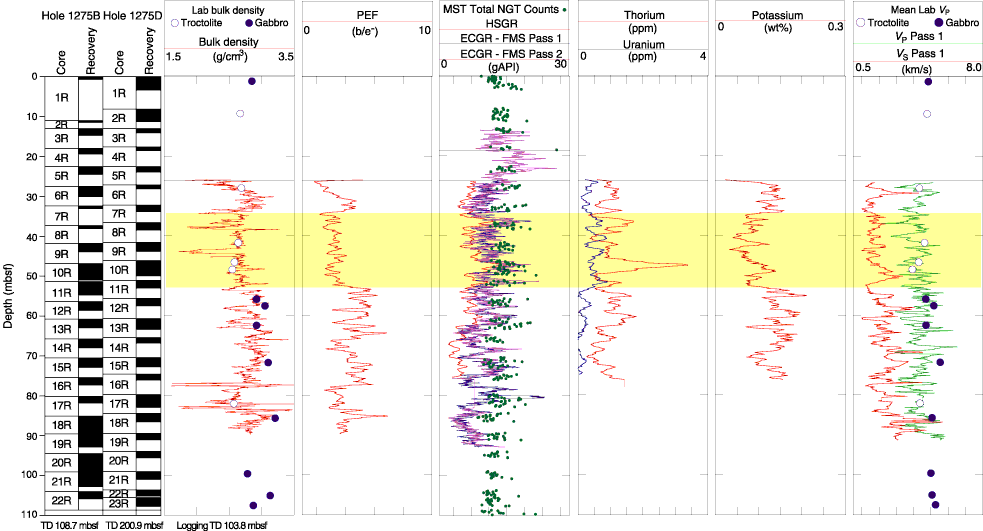
Figure F103. Core recovery, density, photoelectric effect (PEF), gamma ray intensity (total spectral gamma ray [HSGR] and environmentally corrected gamma ray [ECGR]), thorium, uranium, and potassium and compressional and shear wave velocity logs from Hole 1275D. The interval highlighted in yellow shows a low density, photoelectric effect, and potassium interval. This interval also corresponds to the high-porosity interval shown in Figure F102. Shipboard laboratory measured HGR data are plotted with logging gamma ray data for comparison. Similarly, discrete sample velocity measurements are plotted with the logging data. TD = total depth.


![]()