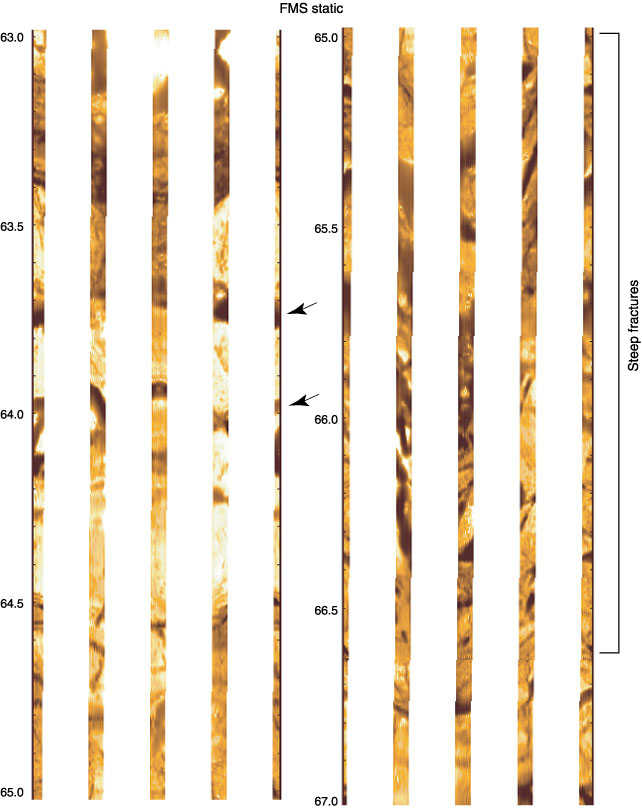
Figure F107. Formation MicroScanner (FMS) static images for 63-67 mbsf. Steep intervals of high resistivity contrast interpreted to represent fractures are evident between 65 and 66.6 mbsf. Arrows indicate the presence of probable shallower dipping fractures.