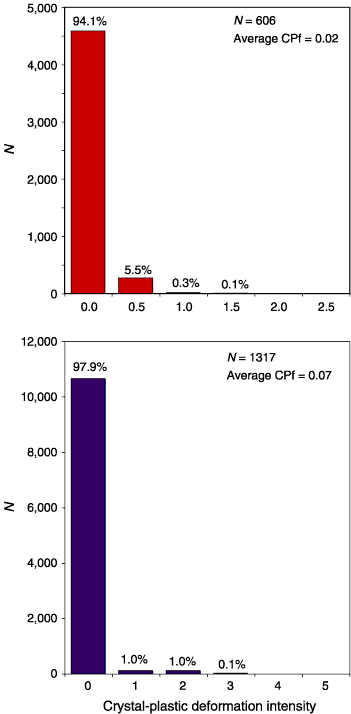
Figure F55. Histograms showing the distribution of crystal-plastic deformation (CPf) by intensity in Holes 1275B and 1275D. Deformation intensity is logged on a scale from 0 (undeformed) to 5 (ultramylonite) as discussed in "Structural Geology," in the "Explanatory Notes" chapter.


![]()