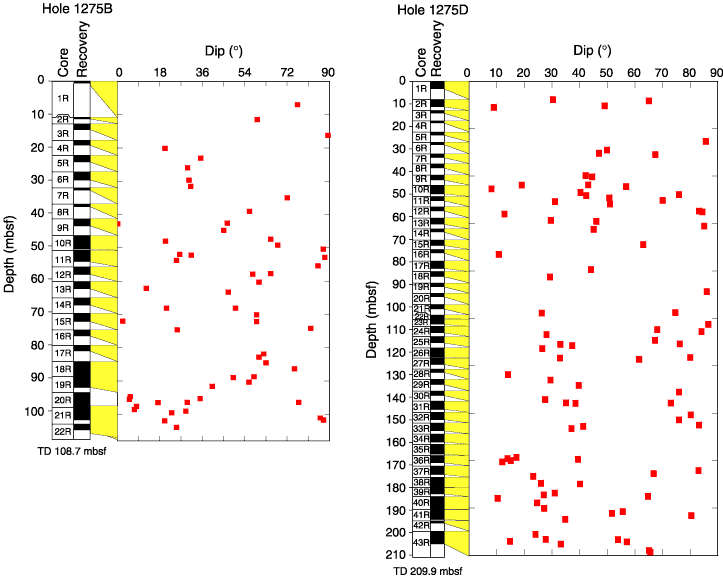
Figure F62. Downhole plot of the measured dips of faults, fractures, and brittle shear zones in Holes 1275B and 1275D. Expanded depth of cored interval is plotted on the vertical axis. Yellow cones reflect the depth range of expansion for each core. TD = total depth.


![]()