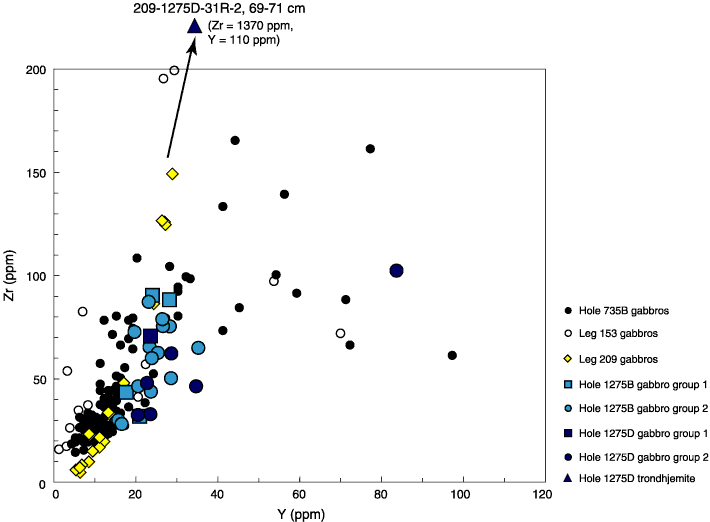
Figure F79. Zr vs. Y for gabbroic rocks from Site 1275. Shown for comparison are gabbroic rocks from Leg 153 (Agar et al., 1997) and from Hole 735B (Dick, Natland, Miller, et al., 1999). The arrow indicates the trajectory toward the trondhjemite sample with extremely high Zr content.


![]()