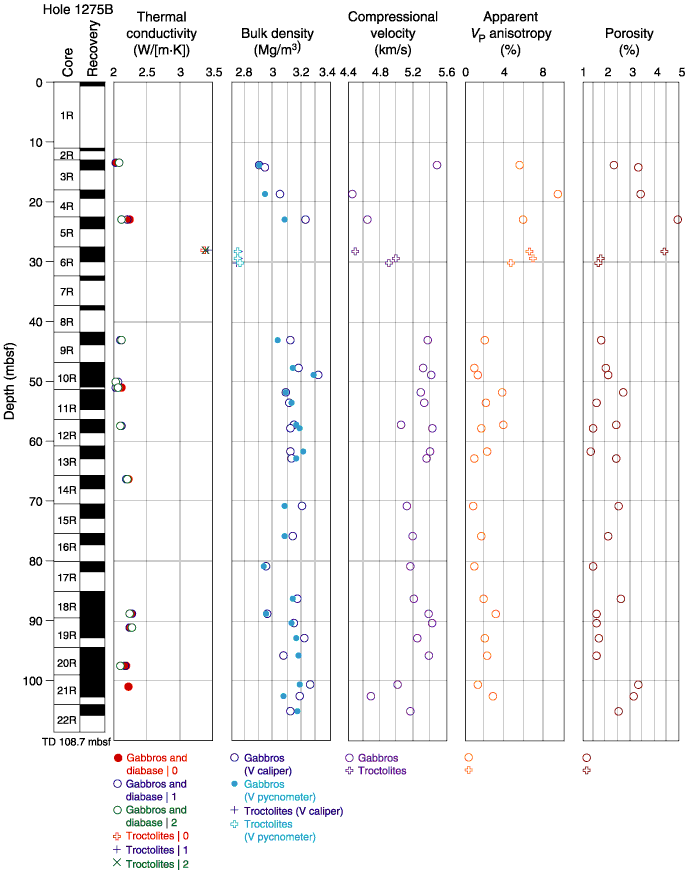
Figure F80. Thermal conductivity, P-wave velocity, apparent P-wave anisotropy, bulk density, and porosity in diabases, gabbros, and one troctolite recovered from Hole 1275B. The numbers 0, 1, and 2 in the legend of the thermal conductivity graph refer to the probe needle orientation with respect to the core axis (0 = parallel to the core axis, 1 and 2 = oblique to the core axis), as shown in Figure F11, in the "Explanatory Notes" chapter. TD = total depth.


![]()