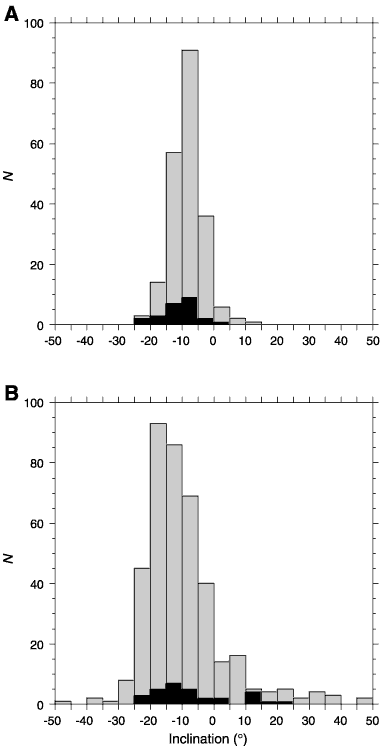
Figure F96.
Histograms of inclinations for discrete samples (black bars) and archive halves (gray bars) from (
A
) Hole 1275B and (
B
) Hole 1275D.