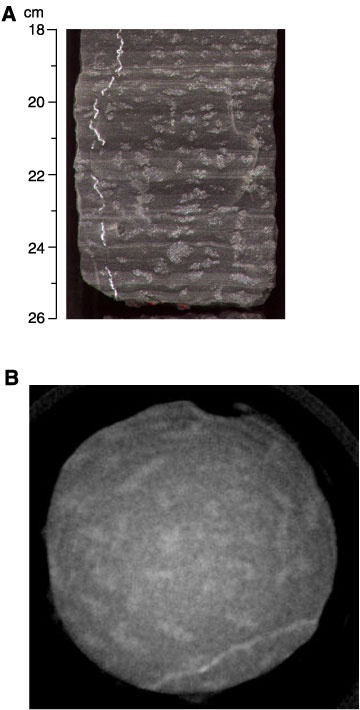
Figure F25. Comparison of (A) core photograph and (B) computed tomography (CT) scan of a porphyroblastic mudrock formed by thermal and hydrothermal effects of the intrusion of the upper diabase sill in lithologic Subunit 5C (interval 210-1276A-87R-6, 18–26 cm). In A, note the once-straight but now vertically compressed vein. In B, the CT scan is a horizontal slice through a three-dimensional reconstructed image, viewed with IMAGEJ software; note the apparent near-random orientation of the
porphyroblasts.