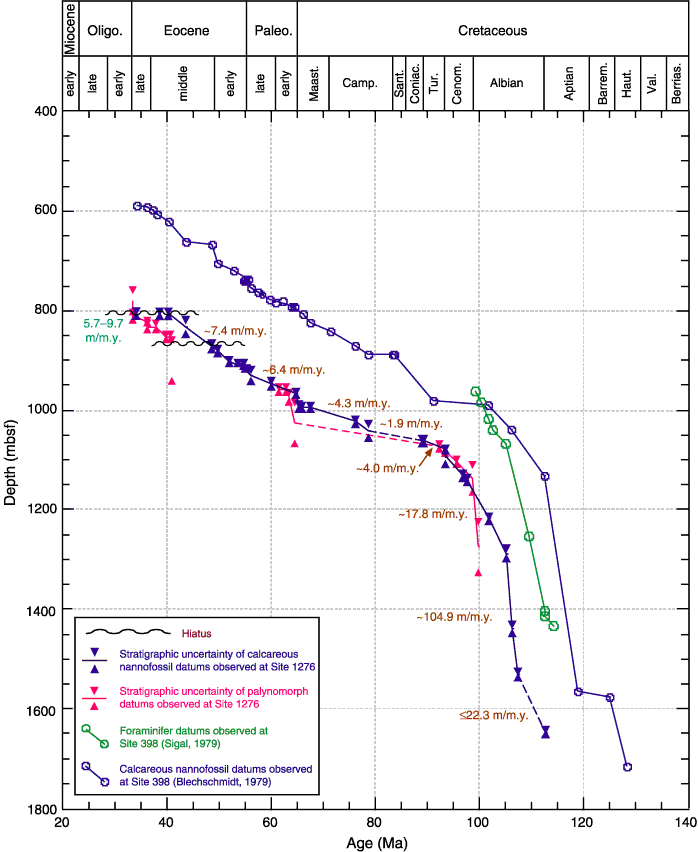
Figure F27. Age-depth plots based on first and last occurrence datums of microfossils at Site 1276 and DSDP Site 398. Dashed lines represent intervals in which no samples were analyzed, age-diagnostic datums are uncertain, or in which samples were found to be barren. Approximate sedimentation rates at Site 1276, based on calcareous nannofossils, are shown in blue, whereas those based on palynomorphs are depicted in red. Datums used to construct age-depth plots at Site 1276 are listed in Table T12
in the "Site 1276" chapter; datums used to construct age-depth plots at Site 398 are listed in Table T13
in the "Site 1276" chapter.


![]()