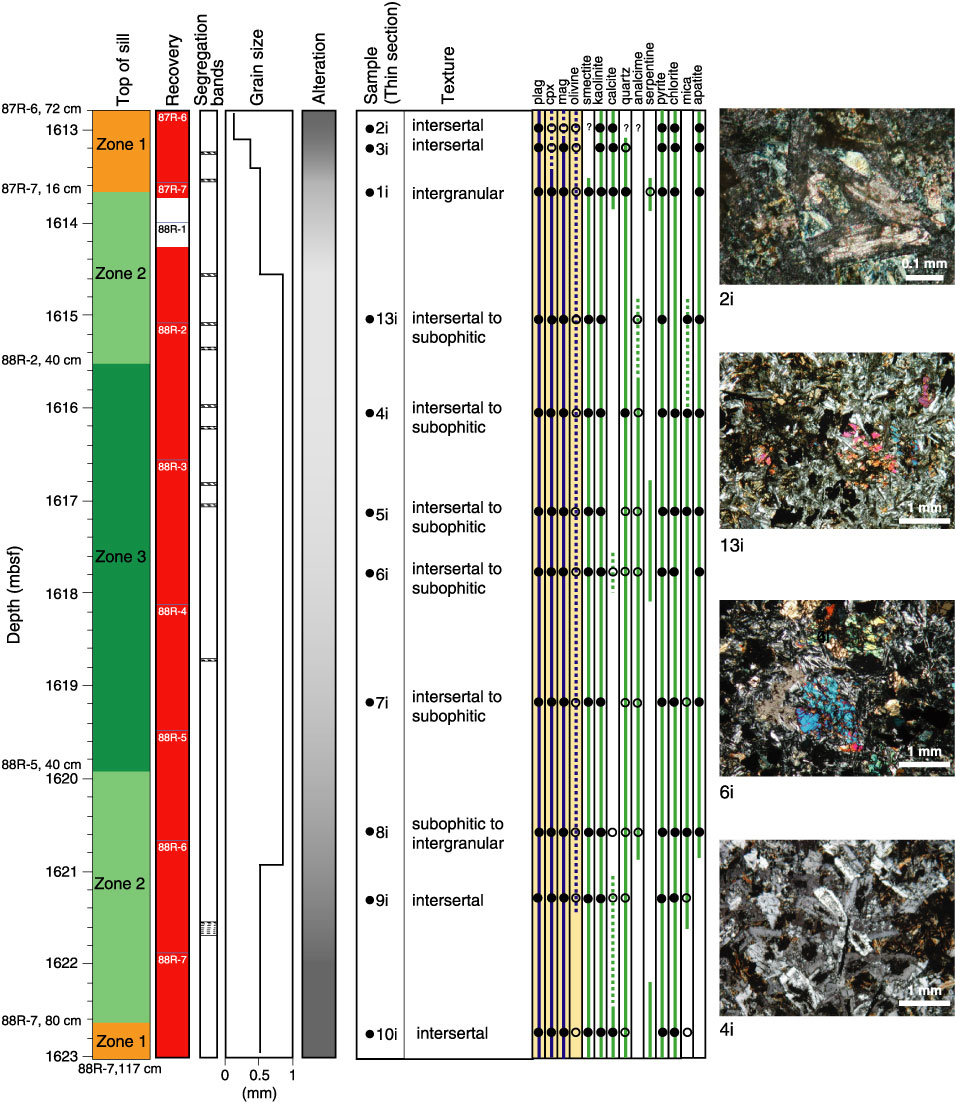
Figure F29. Summary of core recovery and observations of segregation bands, grain size, relative degree of alteration, thin section sample locations, texture, and minerals from
X-ray diffraction data for the upper diabase sill at Site 1276. Photomicrographs 2i (Sample 210-1276A-87R-6, 86–89 cm), 13i (Sample 210-1276A-88R-1, 93–95
cm), and 6i (Sample 210-1276A-88R-3, 121–125 cm) show the texture denoted in the texture column. Photomicrograph 4i (Sample 210-1276A-88R-2, 93–96 cm) shows the mineralogical composition and texture of a segregation band. The alteration is shown with gray shades, where dark gray is complete alteration and lighter shades are moderate alteration. The core
recovery is shown in red. plag = plagioclase, cpx = clinopyroxene, mag = magnetite.