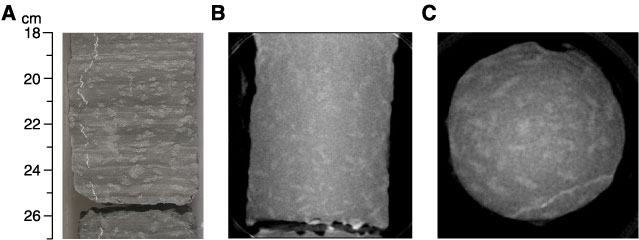
Figure F115. Comparison of a feature observed in a core photograph with CT scans (interval 210-1276A-87R-6, 18-27 cm). A. A porphyroblastic mudrock that is the top of a sandstone  mudstone turbidite. The patchy mineral growth relates to thermal and hydrothermal effects of nearby intrusion of diabase sill Subunit 5C1. The mineral growth appears to be mainly horizontal in the core photograph. B. CT scan of the same interval. Note that the secondary, patchy mineral growth is clearly visible, but the subvertical hydrothermal calcite vein seen in the core photograph (A) is not. In contrast to what is seen in the split-core photograph, the elongate crystals appear to have a near-random orientation. C. A horizontal slice of the same core interval viewed with IMAGEJ software. This image also suggests a near-random orientation of the porphyroblasts. Taken together, images B and C suggest little preferred orientation of these crystals.