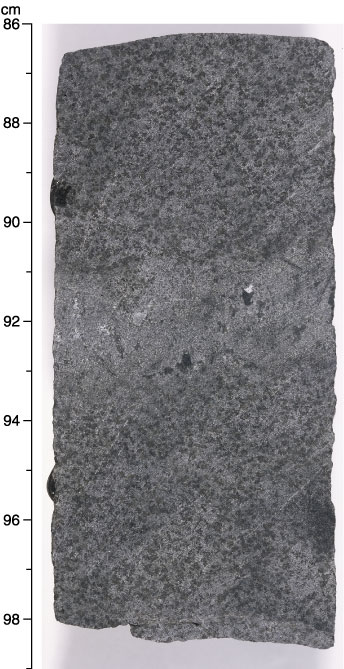
Figure F125. Close-up core photograph showing characteristic texture in zone 3 in the upper sill (interval 210-1276A-88R-2, 86-99 cm). The lighter band corresponds to a more differentiated segregation band, showing distinct (but not sharp) contacts with the host rock.