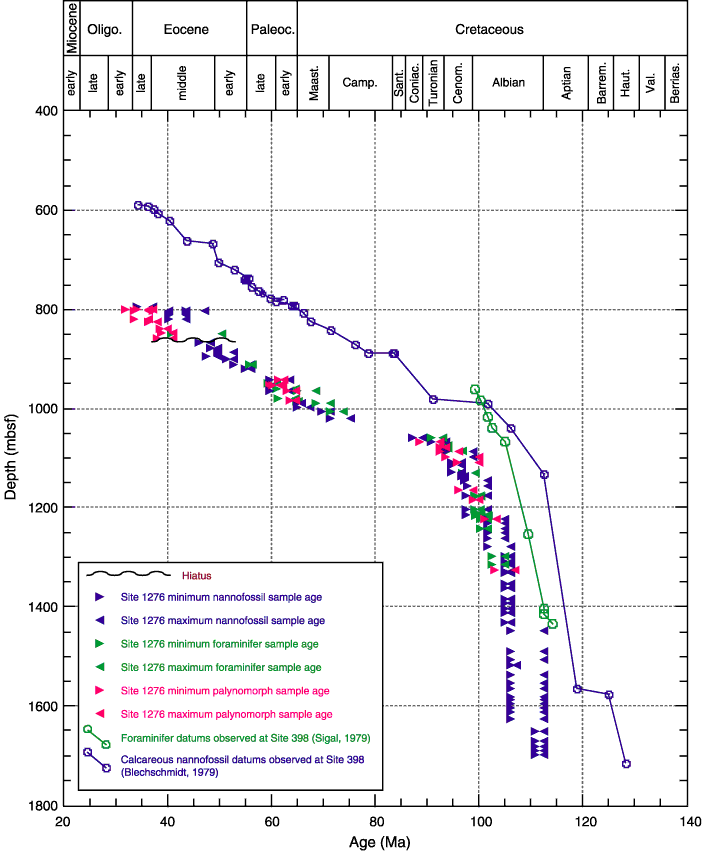
Figure F142. Age-depth plots based on first and last occurrences of microfossils at DSDP Site 398, and zonal boundary ages of microfossils observed at ODP Site 1276. Each set of opposing arrows represents the age of the biozone of one sample analyzed during shipboard operations at ODP Site 1276 (summarized on Table T7). Ages of nannofossil and foraminifer datums in the Site 398 age-depth plot can be found in Tables T1,
T2, T3, T4, and T5, all in the "Explanatory Notes" chapter. Zonations used in estimating microfossil ages can be found in Figures F10 and F11, both in the "Explanatory Notes" chapter. Datums used to construct age-depth plots at Site 398 are listed in Table T13.


![]()