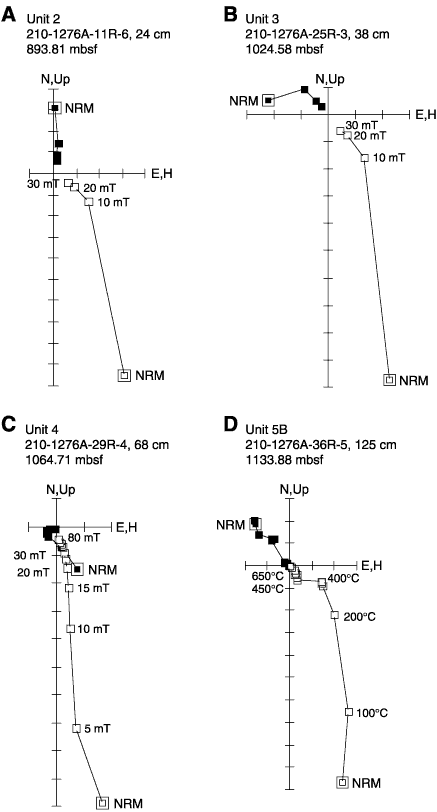
Figure F145. Examples of high-quality Zijderveld diagrams for sediments from (A-C) lithologic Units 2-4 and (D) Subunit 5B. These demonstrate the AF removal of a normal component of remagnetization caused either by drilling or by an overprint from the present geomagnetic field (A-C). The diagrams also show isolation of a more stable component that shows univectorial decay toward the origin of the vector plots (Zijderveld, 1967). An example of demagnetization behavior of a sample during thermal demagnetization is also illustrated (D). Open squares = vector endpoints projected onto the vertical plane, solid squares = vector endpoints projected onto the horizontal plane. These demagnetization behaviors are typical of the majority of samples from Unit 1 through Subunit 5B. NRM = natural remanent magnetization.


![]()