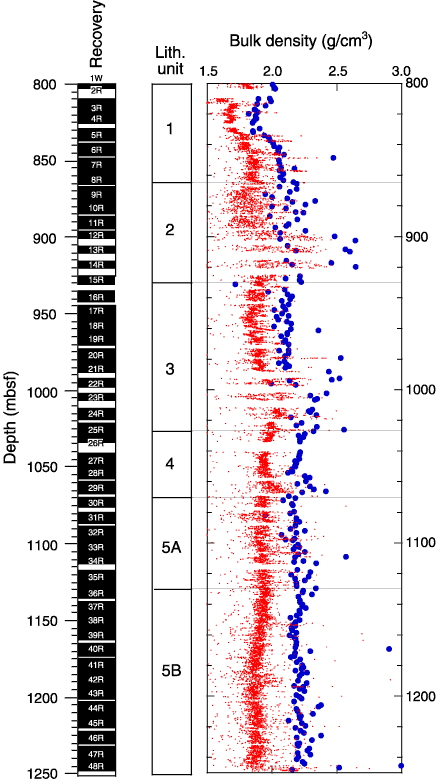
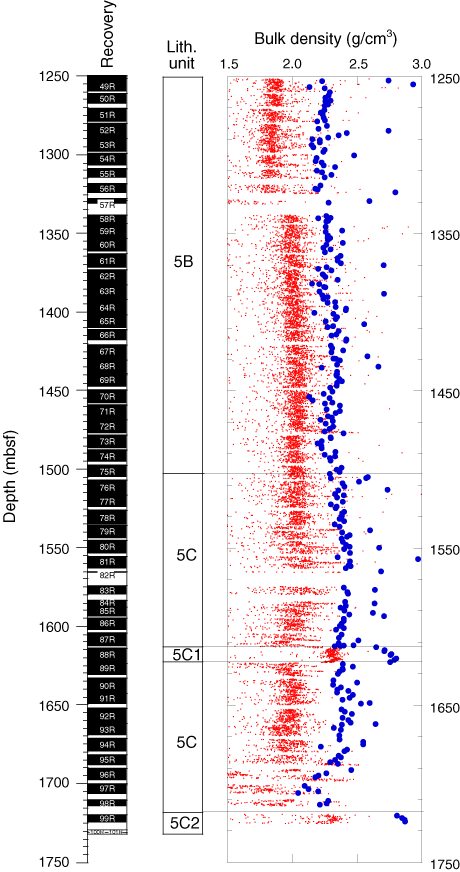
Figure F158.
GRA bulk density (red dots) and MAD bulk density (blue dots) plotted next to core recovery and lithologic units.