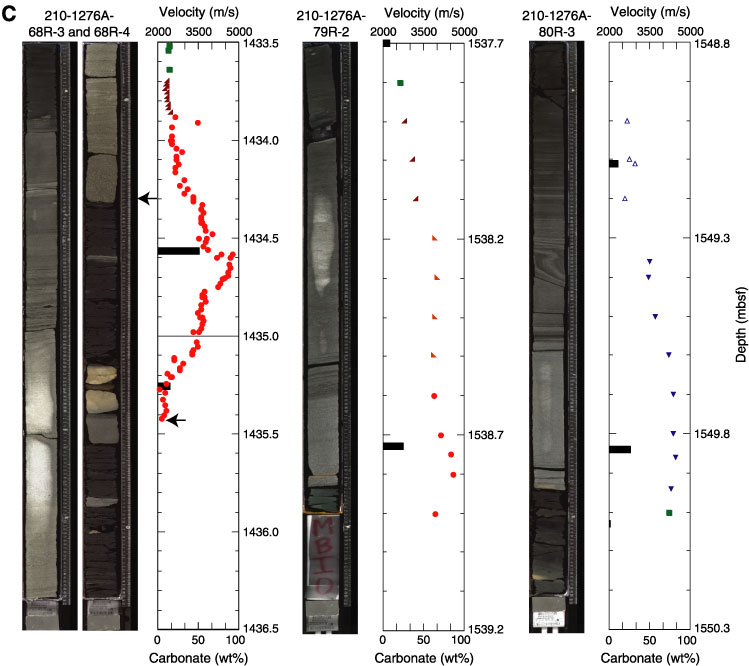
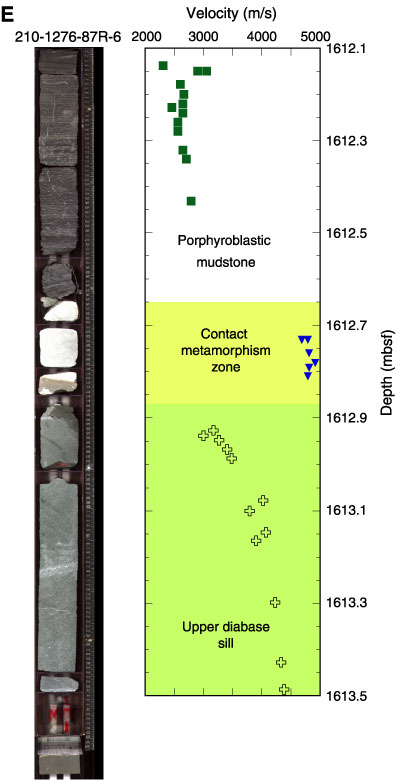
Figure F162. A. P-wave velocity (x-, y-, and z-directions) measured using the P-wave velocity sensor 3 contact probe system, plotted next to core recovery and lithologic units. Lithologic symbols are defined in Figure F160. B. P-wave velocity (x-, y-, and z-directions) measured using the P-wave sensor 3 contact probe system, plotted next to core recovery and lithologic units. Lithologic symbols are defined in Figure F160. C. X-direction velocity measured at 2- to 10-cm spacing over turbidites in Sections 210-1276A-68R-3 and 68R-4, 79R-2, and 80R-3, respectively, plotted next to core photographs of these sections. The arrows on the section at left show the position of the last measurement downcore. CaCO3 is also plotted, and it is indicated with black bars. Note the correlation between high concentrations of CaCO3 and high velocity in fine-grained sandstones, suggesting that carbonate cementation may play a primary role in controlling velocity structure within turbidites. Lithologic symbols are defined in Figure F160. D. CaCO3 percentage (red) vs. normalized x-direction velocity (black). The x-direction velocity has been normalized by subtracting the minimum x-direction velocity (1792 m/s) and dividing by the maximum velocity/100 (64 m/s) to give a normalized x-direction velocity range between 0 and 100 m/s. The CaCO3 and normalized velocity curves are filtered to remove short-wavelength variations. Yellow shading highlights sections in which we judge the positive correlation to be strong. Orange shading locates the two diabase sills, in which we do not anticipate a correlation. E. X-direction velocity measured at 2- to 10-cm spacing over the upper sill/sediment contact preserved in Section 210-1276A-87R-6. Measurements characterize the relatively unmetamorphosed porphyroblastic mudstones, a zone of intense contact metamorphism and the upper section of the sill itself. These measurements indicate that the transition from relatively low sedimentary velocity (2500 m/s) to diabase velocity (5000 m/s) occurs over a very short distance, creating a sharp velocity boundary. Lithologic symbols are defined in Figure F160.