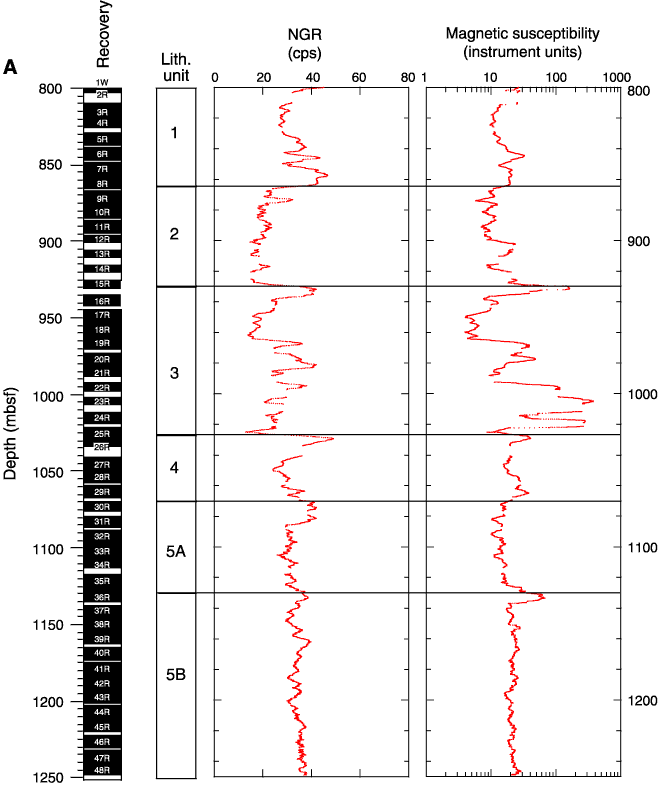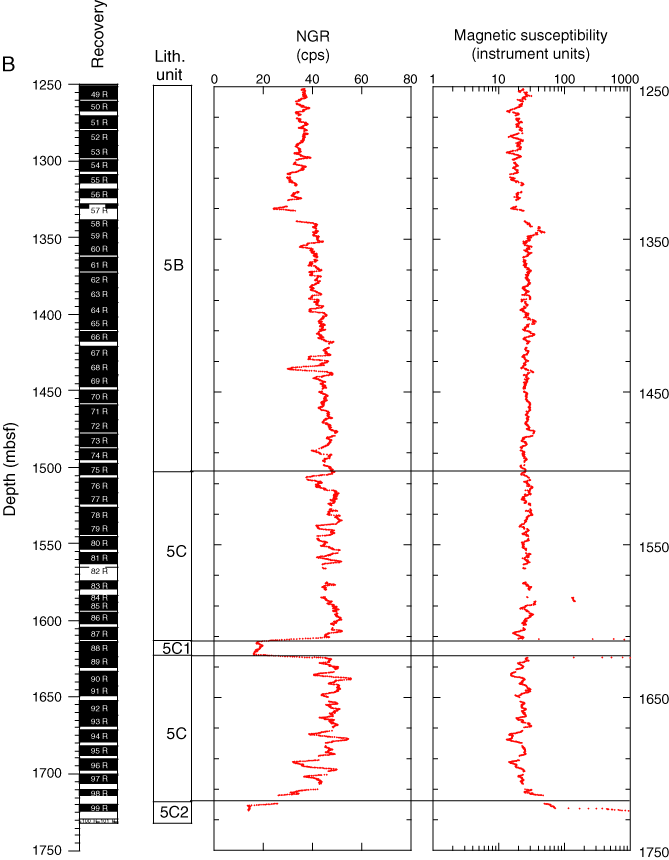
Figure F166. A, B. Natural gamma radiation (NGR) and magnetic susceptibility (MS), smoothed with 100-point running-average filter, vs. depth, plotted next to core recovery and lithologic units. MS values plot offscale for the two sills (Subunits 5C1 and 5C2). For MS, values can be converted to SI units by multiplying by 0.66 x 10⁻⁵.


![]()