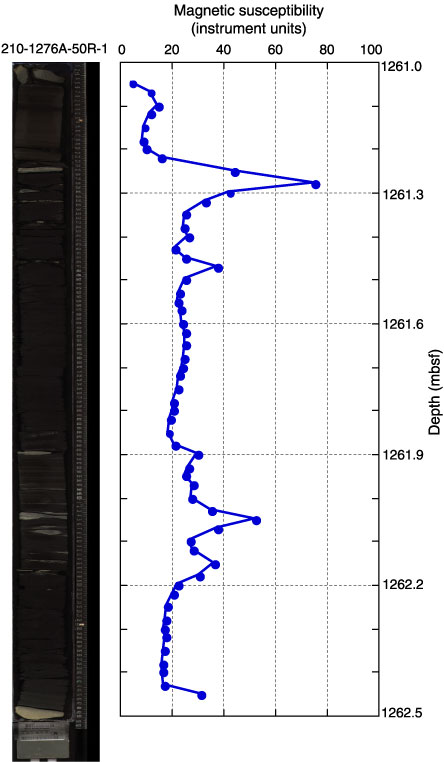
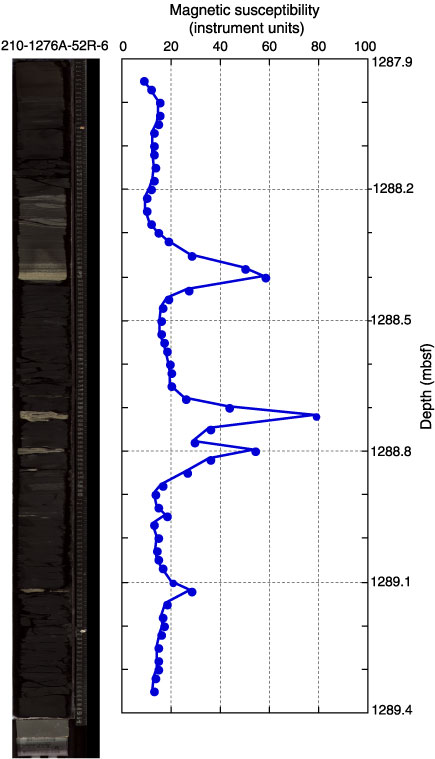
Figure F168.
Digital core images and associated magnetic susceptibility (MS) measurements from the MST. Note strong correlation between MS peaks and light-colored siderite-rich intervals.