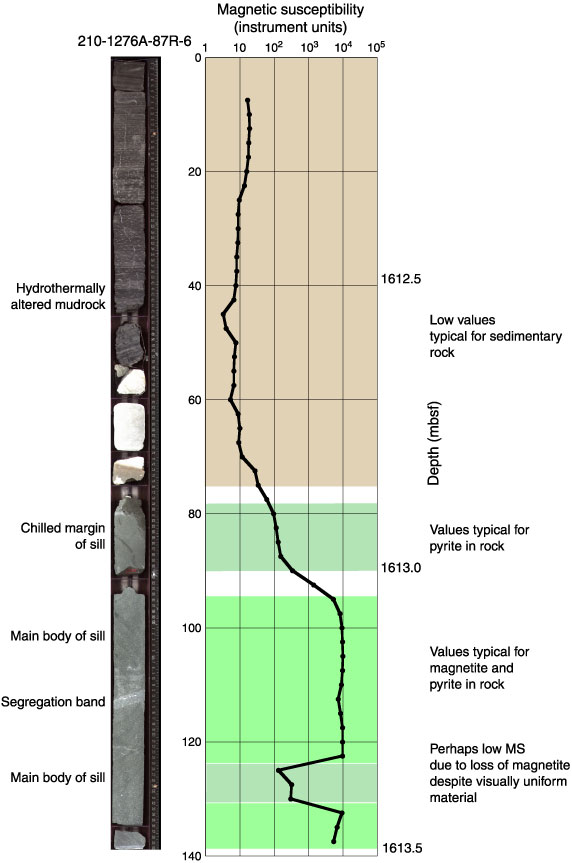
Figure F169.
Digital core image of Section 210-1276A-87R-6 and magnetic susceptibility (MS) measurements from the MST. MS data are plotted on a log scale.