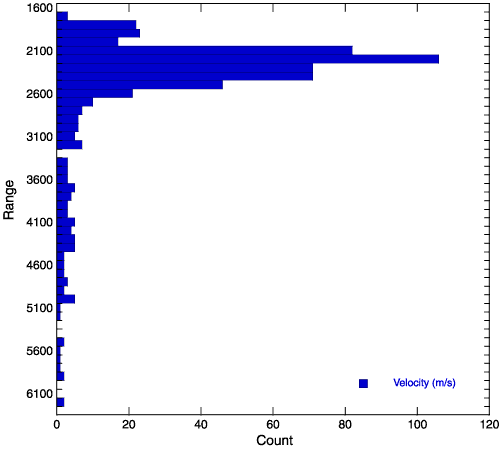
Figure F173.
Histogram showing distribution of z-direction velocity measured on cores. Note that the vast majority of samples have velocity between 2100 and 2500 m/s. These velocities will dominate the time-depth conversion.