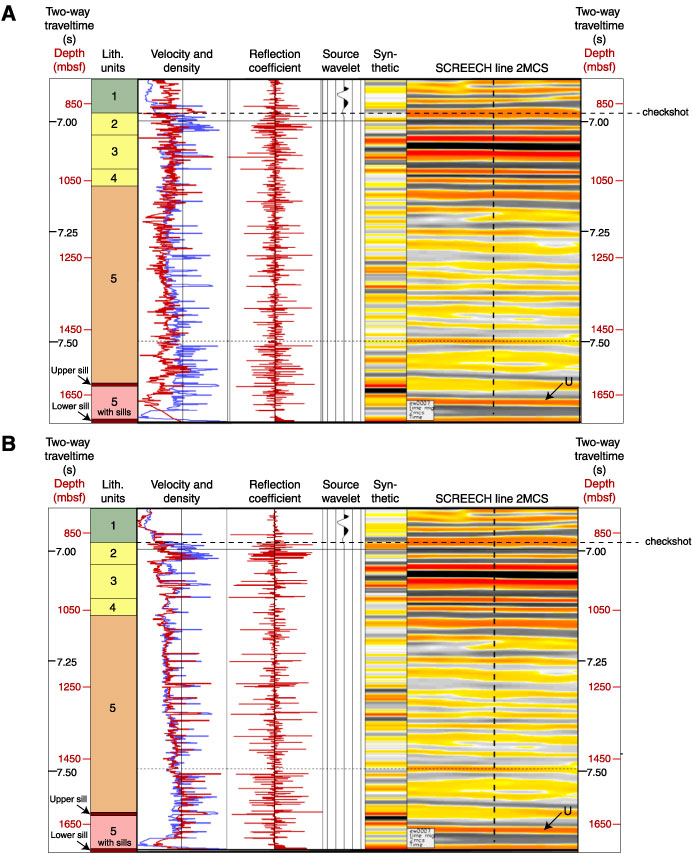
Figure F174. Comparison of synthetic seismograms to seismic reflection data from SCREECH line 2MCS. The synthetic seismograms are generated from reflection coefficients determined from z-component velocity and (A) GRA density and (B) MAD bulk density measured on cores. Positive amplitudes are shown by red to yellow colors, and negative amplitudes are black or gray. In the velocity/density column, velocity values are blue and density values are red. The break between lithologic Units 1 and 2 is inferred to correlate with the strong reflection at ~6.98 s in the SCREECH line 2MCS data and is aligned to this depth. The reflection-time scale is linear, and the depth scale (mbsf) is nonlinear.