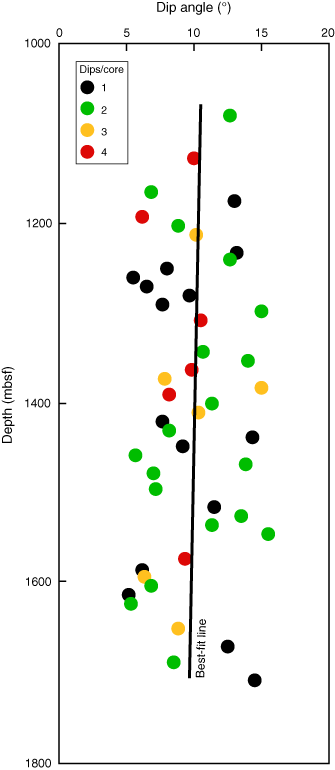
Figure F6. Average core-by-core maximum dip, plotted against the depths of core tops. The number of individual dip determination contributing to each point is indicated by color coding. The dips were measured using XVIEW software. The line of best fit was generated by Microsoft Excel. Scatter about this line decreases as the number of dip determinations per core increases.


![]()