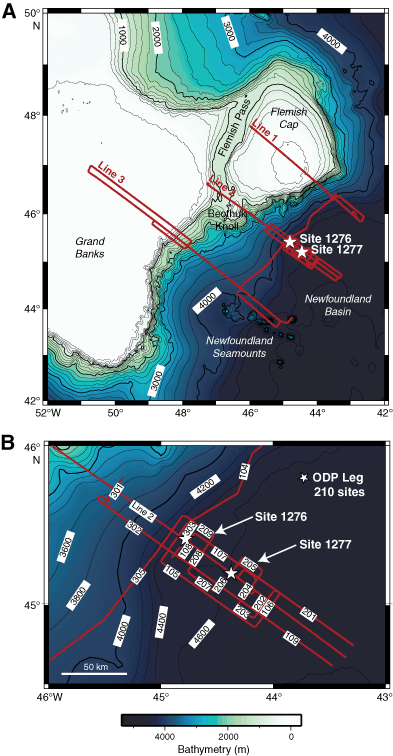
Figure F1. Bathymetric maps of the Newfoundland margin based on the General Bathymetric Chart of the Oceans (IOC et al., 2003). Red lines = seismic reflection profiles from the SCREECH experiment. A. Entire SCREECH experiment with bathymetry contoured at 200-m intervals. B. Seismic lines around the ODP Leg 210 transect with bathymetry contoured at 200-m intervals.


![]()