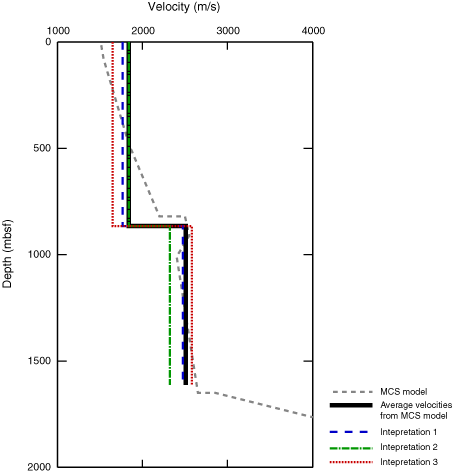
Figure F11. Comparison of average velocities above and below the lithologic Unit 1/2 boundary at 865 mbsf, as estimated by modeling of MCS data and implied by each of the interpretations shown in Figure
F10. See Table T1 for times associated with 865 mbsf for each interpretation and more details on calculated average velocities and differences from average MCS velocities. Note that average velocity implied by Interpretation 2 closely matches average MCS velocity above 865 mbsf but is much lower than average MCS velocity below this level. Average velocity implied by Interpretation 3 is much lower than average MCS velocity above 865 mbsf, but average velocity in the deeper section is higher than MCS velocity. Average velocities implied by Interpretation 1 are relatively close to average MCS velocities both below and above 865 mbsf.


![]()