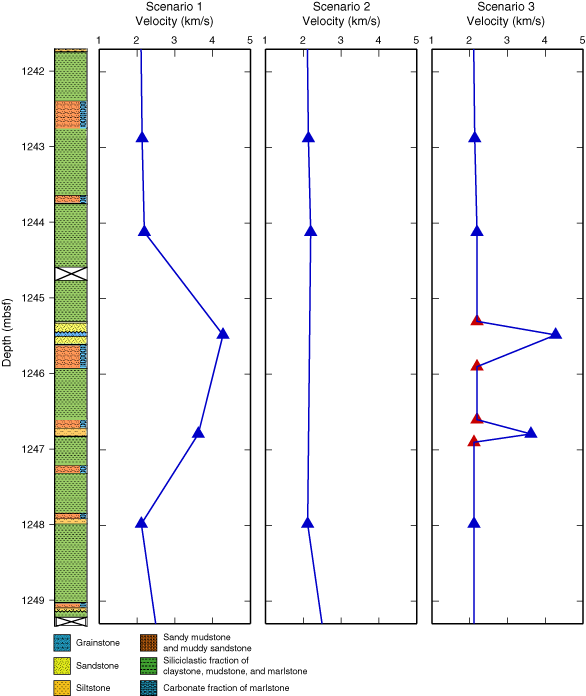
Figure F4. Three scenarios for processing physical property measurements to address possible sampling biases. Graphic lithology is based on shipboard core description from 1242 to 1249 mbsf (Unit 5) (Shipboard Scientific Party, 2004). Blue triangles = measurements of vertical P-wave velocity at discrete locations. Note that two of these measurements were taken from thin (<5 cm) lithologic intervals with velocities that are not representative of the surrounding 2 m of core. This has potentially important consequences for synthetic seismograms derived from these measurements. We explore the effects of possible biases in sample selection in the following three ways: Scenario 1 = create synthetics from measured velocities and densities without modifying apparent bed thickness implied by spacing between measurements, Scenario 2 = remove measurements that are >3 km/s in lithologic Unit 5 if measurement was made on sample from a thin (<1 m) lithologic layer, and Scenario 3 = modify range of depths over which measurements of velocity >3 km/s is extrapolated so that it is similar to the thickness of the lithologic interval from which it was taken.


![]()