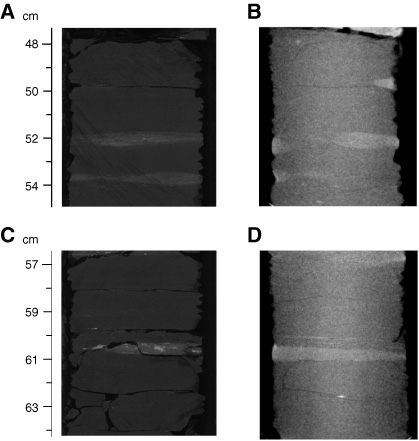
Figure F7. A, B. Calcareous claystone (Sample 210-1276A-61R-2, 47–55 cm); (A) digital image of split surface; (B) 2-D X-ray image. Split surface and CT images are offset by 90° or more. C, D. Calcareous claystone (Sample 210-1276A-61R-2, 56–64 cm); (C) digital image of split surface; (D) 2-D X-ray image. Split surface and X-ray images are offset by 90° or more because C and D correlate with A and B, respectively.