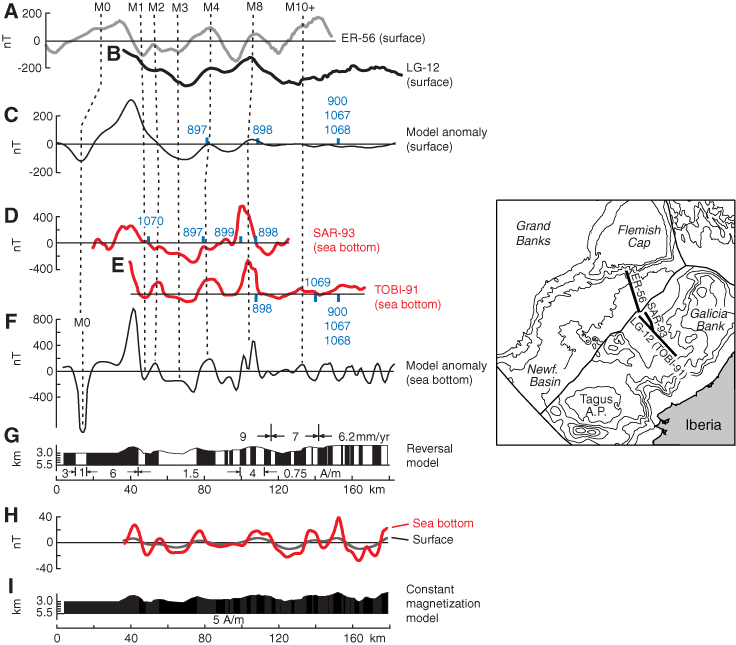
Figure F7. Correlation between observed magnetic anomalies and calculated M-sequence anomalies for conjugate magnetic profiles in the northern Newfoundland-Iberia rift, adapted from Srivastava et al. (2000). Profile locations are shown on the inset map, and ODP drill sites along the profiles are noted in blue. A, B. Profiles ER-56 and LG-12 are conjugate surface profiles; the ER-56 profile from the Newfoundland margin has been flipped end-for-end to facilitate comparison with the LG-12 profile. C. Modeled surface magnetic anomaly, based on the reversal model in G. D, E. SAR-93 and TOBI-91 deep-tow magnetic profiles from the Iberia margin along the western part of the Leg 149/173 drilling transect (Whitmarsh et al., 1996a; Sibuet et al., 1996). F. Corresponding modeled magnetic anomaly at the sea bottom. The TOBI-91 deep-tow profile is along the same line as the LG-12 surface profile. G. Reversal model shows thickness of the magnetic layer, extension rates (computed by using the Kent and Gradstein, 1986, timescale), and magnetization. H, I. In I at the bottom of the figure, a model with basement topography and constant magnetization (5 A/m) is shown to evaluate the effect of the basement topography. Magnetization direction (Dr = 0° and Ir = 46°) is from Van der Voo (1990) for the mid-Cretaceous. Corresponding magnetic anomalies in H are calculated at the sea surface (gray line) and sea bottom (red line). They show that variations of the basement topography explain only ~10% of the observed magnetic anomaly amplitude (note that H has an amplitude scale different from the scales in A–F).


![]()