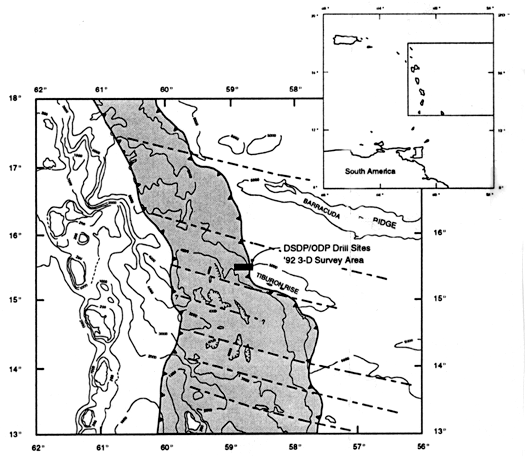
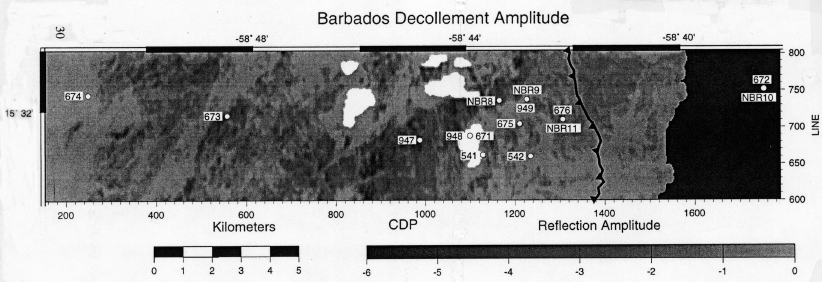
Figure 171B-3. Location map of 3D seismic survey. Locations of past and proposed drilling sites overlay gray tones of map showing seismic reflection amplitude of decollement and proto-decollement. Note that positive reflection polarities are white. Gray shading represents increasing negative reflection amplitudes.