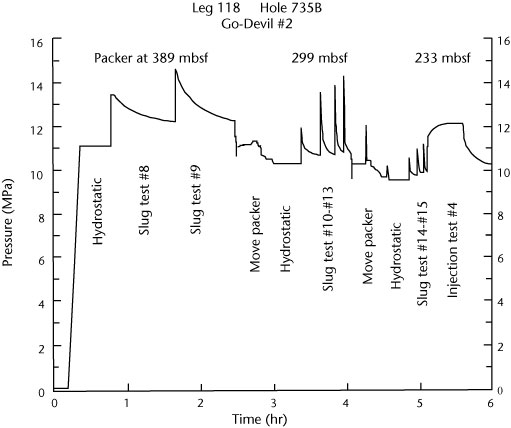
Figure 2. Graph of a
packer injection test taken during Leg 118 showing pressure at the recorder
depth vs. time. The chart shows the hydrostatic pressure, the pressure buildup
from pumping water into the formation, and the subsequent pressure decay
(fall-off) after pumping ceases. The rate of pressure decay indicates the
relative permeability of the exposed interval (with adjustments for interval
height, viscosity, etc.). The packer was moved to test different intervals in
this chart.