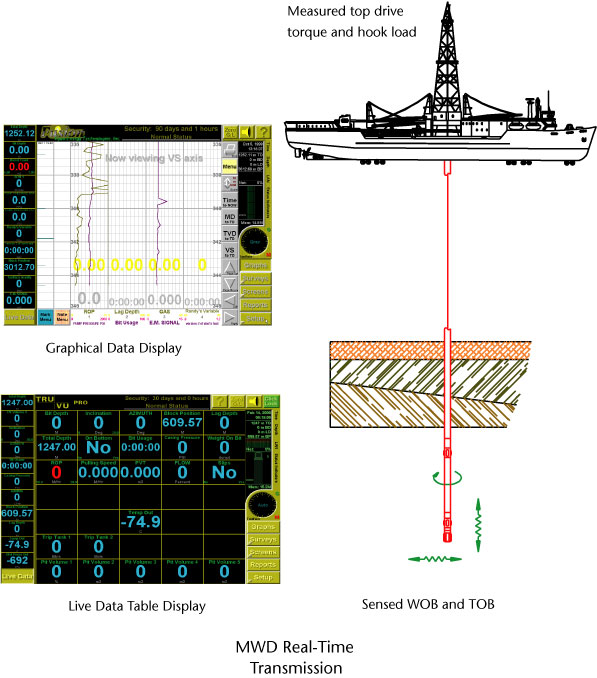
Figure 3.
The two diagrams on the left illustrate the two live data displays: graphical (top) or data table (bottom). The data table is the default screen. To move to the graphical display, one clicks on the green “Graphs” button on the right hand side of the screen. The diagram on the right illustrates Real-Time transmission when using a measurement-while-drilling (MWD) tool. Top drive torque and hook load are measured in the derrick during all drilling/coring. The MWD sensor measures WOB and Torque on Bit (TOB) at the bit and transmits the data to the RIS via a sensor sub.