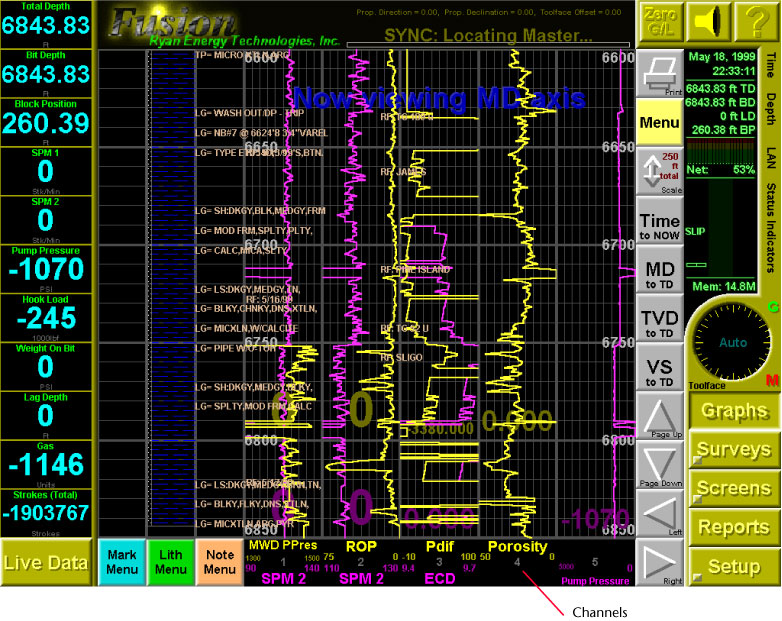
Figure 4.
Screen capture of the RIS live data graphical view, showing the five channels. Each channel can display two traces each for 10 traces total. The eight traces (two traces are not being utilized) displayed in this example are MWD pore pressure, ROP, pressure drop across the bit (Pdif), porosity, strokes per minute (SPM2) on two traces, equivalent circulating density (ECD) or mud weight, and pump pressure.