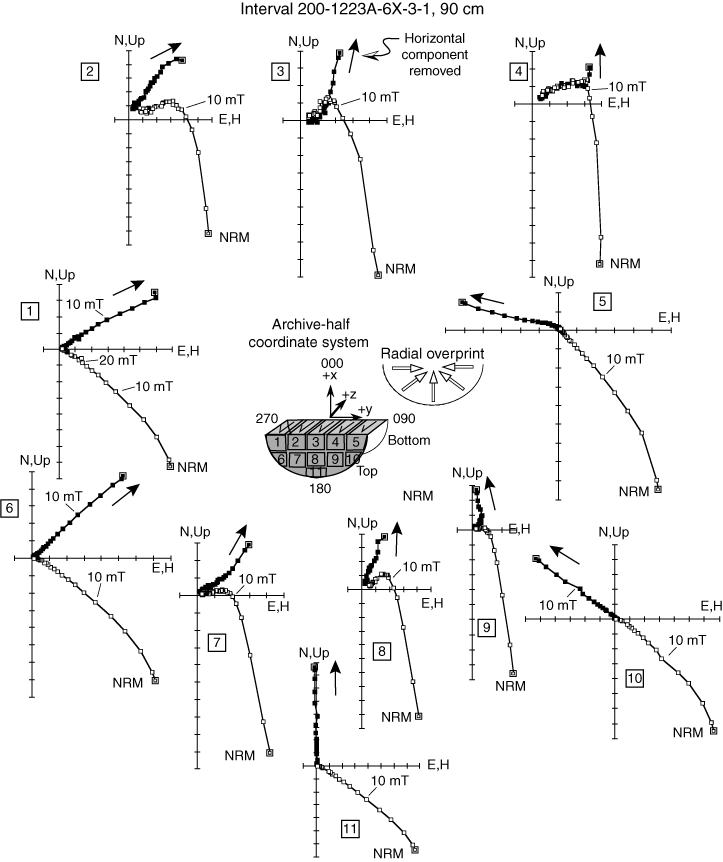
Figure F26. Orthogonal vector demagnetization plots for 11 samples taken from a 1-cm-thick slice of vitric tuff. The <1-cm3 pieces from near the periphery differ from those near the center in the degree of drilling overprint. For example, Pieces 3 and 4 are the least overprinted, and they are nearest the center of the core. They also have a steeper overprint than those samples near the periphery. The drilling overprint deflects the declination of all samples toward the center of the core as shown by the arrows on each diagram (from Leg 200 Shipboard Scientific Party, 2003).


![]()