![]() Figures 1-20
Figures 1-20
![]() Figures
21-40
Figures
21-40
![]() Figures
41-60
Figures
41-60
![]() Figures
61-65
Figures
61-65
![]() Tables 1-22
Tables 1-22
![]() Log
Summary Figures
Log
Summary Figures
Figure 41. Two parallel shear zones in matrix and serpentinized peridotite.
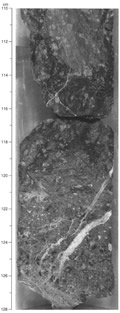
Figure 42. Highly sheared clast of serpentinite.
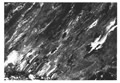
Figure 43. Mylonitized microgabbro.
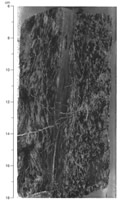
Figure 44. Serpentine and calcite veins within a clast of serpentinized peridotite.
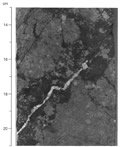
Figure 45. Calcite vein showing stages of crystallization along a vein of white serpentine.
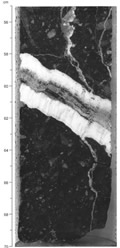
Figure 46. Clast offset along a calcite vein.
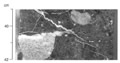
Figure 47. Vein with clastic texture in diabase.
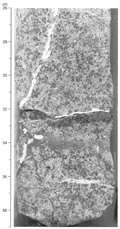
Figure 48. Vein with clastic texture crosscutting and offsetting calcite vein.
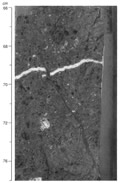
Figure 49. Sulfate, alkalinity, ammonia, and iron profiles for Site 899.
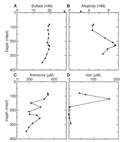
Figure 50. Manganese, calcium, magnesium, and potassium profiles for Site 899.
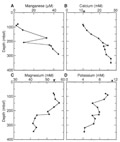
Figure 51. Silica profile for Site 899.
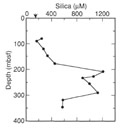
Figure 52. Physical properties summaries.
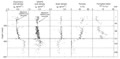
Figure 53. Electrical resistivity measurements, Hole 899B.
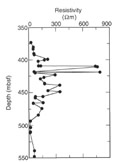
Figure 54. Undrained shear strength measurements, Hole 899A.
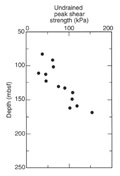
Figure 55. Acoustic velocity and anisotropy measurements, Holes 899A and 899B.
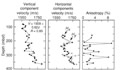
Figure 56.
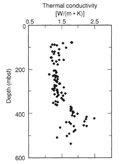
Compressional-wave velocity measurements, Hole 899B. Figure 57. Thermal conductivity measurements, Holes 899A and 899B. Figure 58.
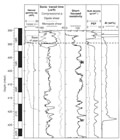
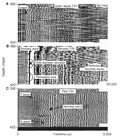
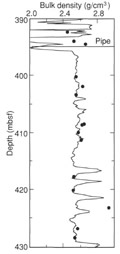
Composite plot of logs recorded in Hole 899B. Figure 59. Sonic waveforms from the DSI tool, Hole 899B. Figure 60. Log and shipboard discrete laboratory measurements of bulk density.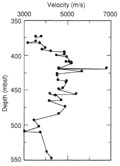
![]() Figures 1-20
Figures 1-20
![]() Figures
21-40
Figures
21-40
![]() Figures
41-60
Figures
41-60
![]() Figures
61-65
Figures
61-65
![]() Tables 1-22
Tables 1-22
![]() Log
Summary Figures
Log
Summary Figures