![]()
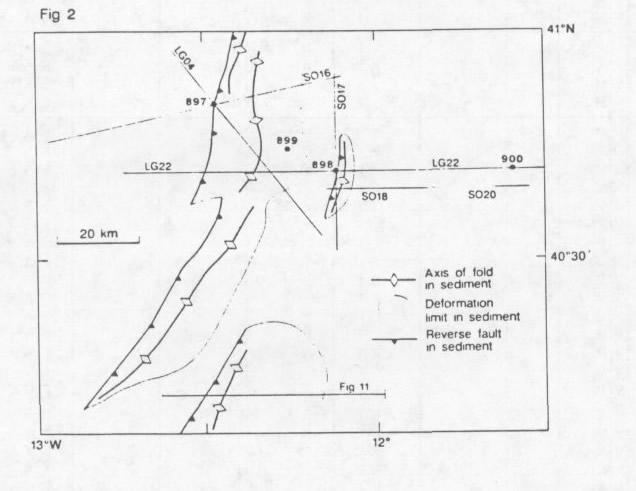
Figure 2. Location map of the line drawings of interpreted seismic lines shown on Figure 3. Part of the structural map of Masson et al. (1994) is included to show the distribution of Miocene folding and faulting. (This figure is available in PDF format.)
![]()