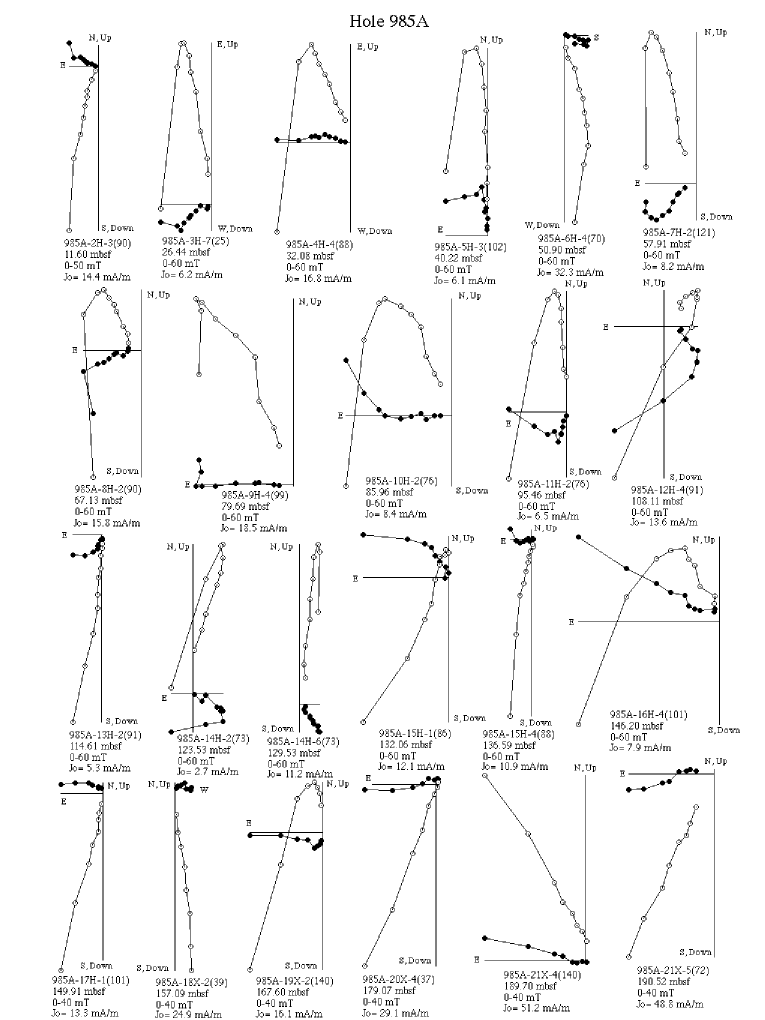
Figure 6. Orthogonal projection of AF demagnetization data from discrete samples in the 0-200 mbsf interval of Hole 985A. Open and solid symbols indicate projections on the vertical and horizontal planes, respectively. Symbols and abbreviations as in Figure 2.

![]()