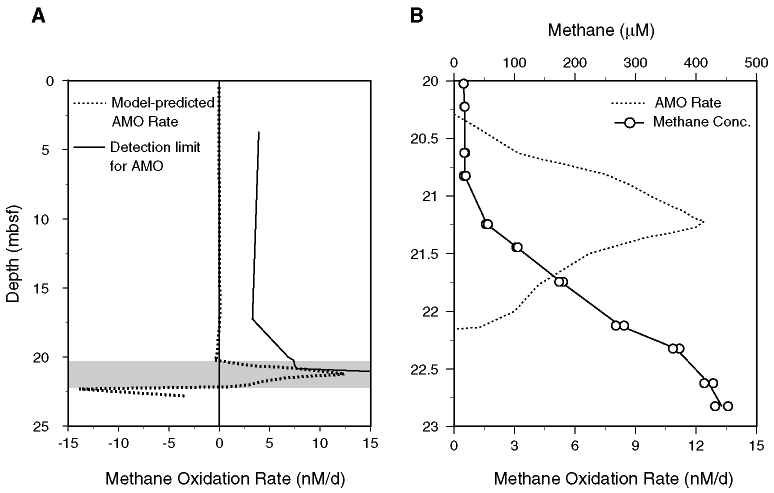
Figure 2. Rates of anaerobic methane oxidation vs. depth in sediments from Hole 995B. A. Methane oxidation rates derived from inverse numerical advection-diffusion-reaction modeling of the methane concentration profile, along with the calculated detection limit of the 14C-tracer-based AMO rate measurement. Note that over the entire sediment column, the model predicts rates that are lower than or at the detection limit. Negative values for model-derived methane oxidation rates indicate methane production. B. Blow-up of the 20-23 mbsf depth interval showing the relationship of the model-derived AMO rates to the region of upward concavity in the methane concentration profile. The model and parameters are described in detail by Borowski et al. (Chap. 9, this volume). The shaded region in A is used to denote the depth interval over which the model predicts the occurrence of AMO, as applied in Figure 3 and Figure 4. SR = sulfate reduction; AMO = anaerobic methane oxidation.

![]()