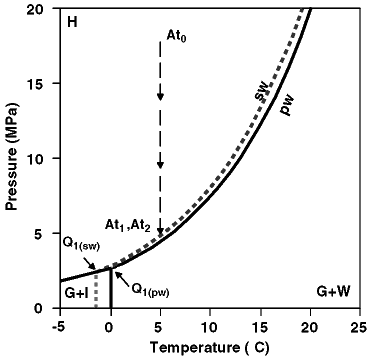
Figure 1. Temperature-pressure phase diagrams for the pure CH4-pure water (pw) and pure CH4-seawater (sw) systems at high CH4 concentration (Dickens and Quinby-Hunt, 1994). There are four phases—CH4 gas (G), CH4 hydrate (H), water (W), and ice (I)—separated by three equilibrium curves. The intersection of the equilibrium curves is the quadruple point (Qa1). A core recovered at high pressure and moderate temperature will change positions on this diagram as pressure is released over time. Path A is the expected change in position for a core maintained at constant temperature of 5ºC as pressure is decreased from initial pressure of 18 MPa at At0 to 4.95 MPa at At1 and At2 (see text). This phase diagram is not appropriate at low CH4 concentrations during the pressure decrease from At2 to At3 (see Fig. 2).

![]()