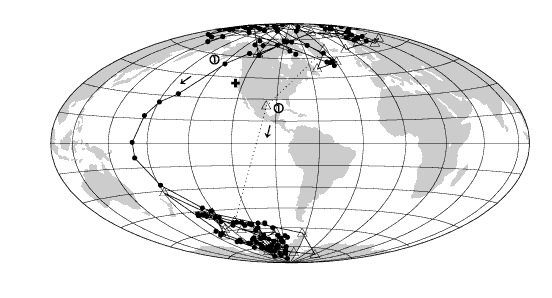
Figure
4. VGP paths for the upper Jaramillo transition at Site 1020 (solid
dots = u-channel measurements, open triangles = discrete samples). The only
intermediate discrete sample is marked with a "1" as well as the
u-channel measurement from the same depth interval. The corresponding Zijderveld
diagrams with the AF-demagnetization behavior are shown in Figure
2B.
![]()