![]() Figures F1-F12
Figures F1-F12
![]() Tables
T1-T5
Tables
T1-T5
F1. Location map showing existing ODP boreholes analyzed as a part of the New Jersey transect.
F2. Surficial, ?Cohansey Formation, and Cohansey Formation.
F3. Kirkwood-Cohansey and Kw3 sequences from the Kirkwood formation.
F4. Kw2 sequences from the Kirkwood Formation.
F5. Kw1 and Kw0 sequences from the Kirkwood Formation.
F6. Atlantic City and Sewell Point Formations.
F7. Absecon Inlet and Shark River Formations.
F8. Age-depth plot for the Miocene sequences.
F9. Age-depth plot for the Oligocene sequences.
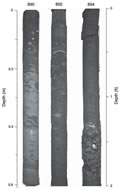
F10. Photographs showing a complete Kw0 sequence.
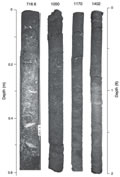
F11. Photographs of sequence boundaries.
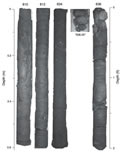
F12. Photographs of facies changes within sequences.
T1. Core descriptions, Ocean View borehole.
T2. Dinocyst occurrences, Ocean View borehole.
T3. Eocene planktonic foraminiferal occurrences, Ocean View borehole.
T4. Eocene benthic foraminiferal occurrences, Ocean View borehole.
T5. Sr-isotopic data, Ocean View borehole.