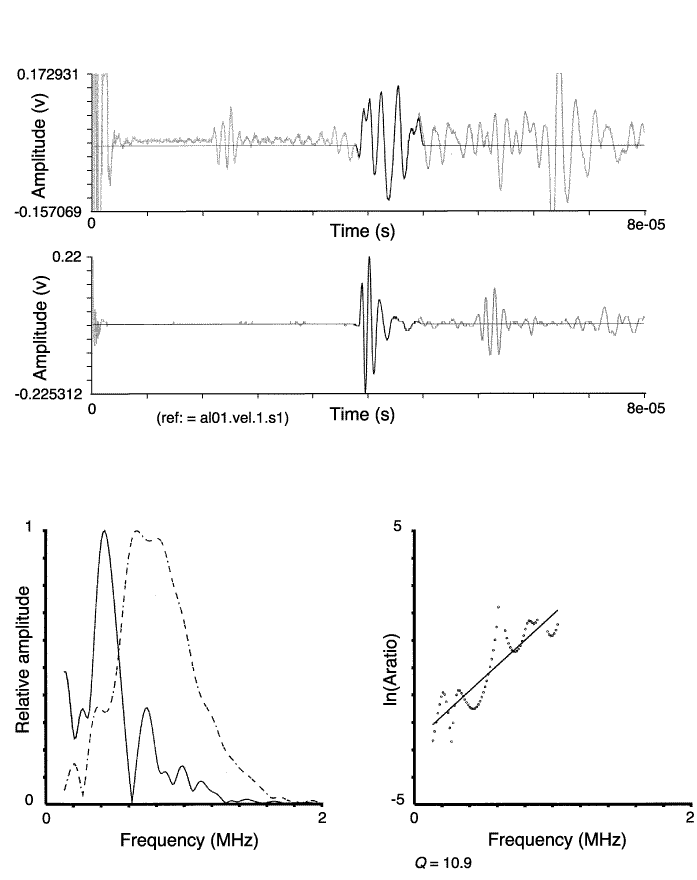
Figure F5. The shear wave attenuation is computed using the same procedure as outlined in Figure F4, but substituting the shear velocity for c. In the shear case, however, the waveforms are much more distorted during propagation through the gabbro (top plot). The slope of the spectral ratios, which is used to compute Q, is highly nonlinear, and the shear attenuation value (Q = 10.9) is suspect.
![]()