![]() Figures F1-F33
Figures F1-F33
![]() Tables
T1-T12
Tables
T1-T12
F1. Location of Hole 735B on the Southwest Indian Ridge.
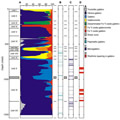
F2. Lithologic column for Hole 735B showing the 12 major lithologic units.
F3. Downhole variation of olivine compositions (Fo).
F4. Downhole variation of orthopyroxene compositions (Mg#).
F5. Downhole variation of clinopyroxene compositions (Mg#).
F6. Downhole variation of plagioclase compositions (An content).
F7. Downhole variation of SiO2.
F8. Downhole variation of Al2O3.
F9. Downhole variation of TiO2.
F10. Downhole variation of Fe2O3total.
F11. Downhole variation of MnO.
F12. Downhole variation of MgO.
F13. Downhole variation of Mg#.
F14. Downhole variation of Mg#80.
F15. Downhole variation of CaO.
F16. Downhole variation of Na2O.
F17. Downhole variation of K2O.
F18. Downhole variation of P2O5.
F19. Downhole variation of H2O.
F20. Downhole variation of CO2.
F21. Downhole variation of S.
F22. Downhole variation of V.
F23. Downhole variation of Ni.
F24. Downhole variation of Cr.
F25. Downhole variation of Zn.
F26. Downhole variation of Cu.
F27. Downhole variation of Y.
F28. Downhole variation of Zr.
F29. Downhole variation of Sr.
F30. Downhole variation of Sm.
F31. Downhole variation of La/Yb.
F32. Chondrite-normalized REE plots of representative samples.
F33. Plot of La/Yb vs. Yb.
T1. Average primary modal compositions of major lithologies.
T2. Modal data by X-ray diffraction analysis.
T3. Average modal compositions of lithologic units.
T4. Average compositions of minerals in major rock types.
T5. Representative olivine compositions for major rock types.
T6. Representative orthopyroxene compositions for major rock types.
T7. Representative clinopyroxene compositions for major rock types.
T8. Representative plagioclase compositions for major rock types.
T9. Representative ilmenite compositions for major rock types.
T10. Geochemical database for shipboard and shore-based analyses of samples.
T11. Major and trace element data for reference rocks BM, BHVO-1, and ODP Bas 140.
T12. Average chemical compositions of lithologic units.