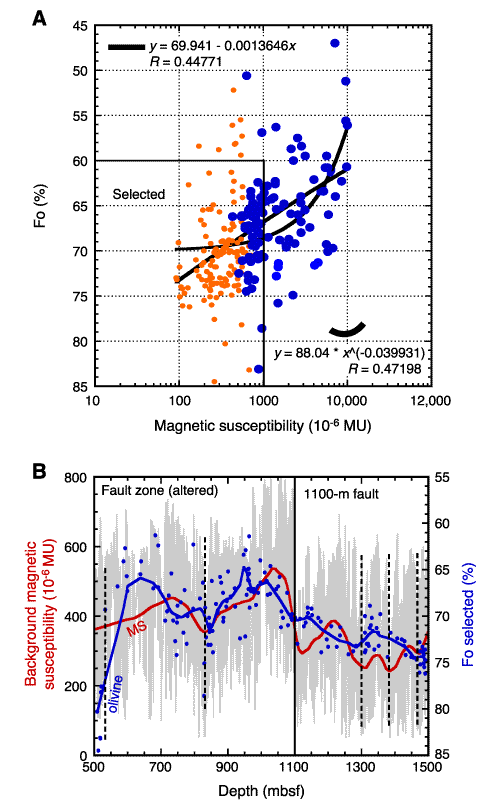
Figure F36. A. Magnetic susceptibility (x 10-6 MU) vs. compositions of olivine (Fo%) at corresponding intervals. Data are divided into samples from intervals with background magnetic susceptibility (small dots) and those above background from peaks and peak regions (large dots). Linear and power-law curves are also shown. These have poor correlation coefficients (r = 0.45 and 0.47, respectively). The box encloses selected samples with Fo > 60 and magnetic susceptibility < 1000 x 10-6 MU, as discussed in the text. B. Background magnetic susceptibility (gray) from Figure F10,
and Fo contents of olivines selected in A (dots) plotted vs. depth. Curves smooth magnetic susceptibility over 10% of the data (MS), and olivine compositions over 5% of the data (olivine). The fault at 1100 mbsf is shown by the solid vertical line. The dashed vertical lines correspond to minima on the susceptibility curve. The smoothed curves correspond reasonably well except in the zone of fractured altered rock and low recovery from 500 to 650 mbsf. The abrupt change in magnetic susceptibility at the base of the fault zone at 1100 mbsf corresponds to a less distinct downhole increase in Fo contents of olivine at the same depth.


![]()