![]()
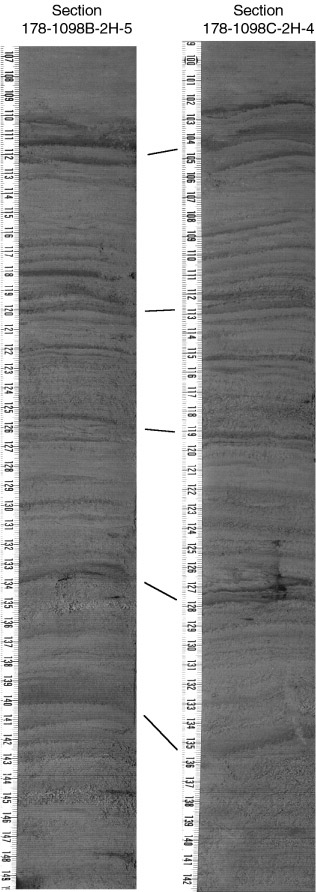
Figure F5. Image data for Holes 1098B and 1098C, corresponding to the interval between 14.0 and 14.4 mcd in Hole 1098B in Figure F4, showing that most individual dark laminae can be traced between holes. Note that images are a gray-scale translation of the original color files, and that contrast and brightness are enhanced.
![]()