![]()
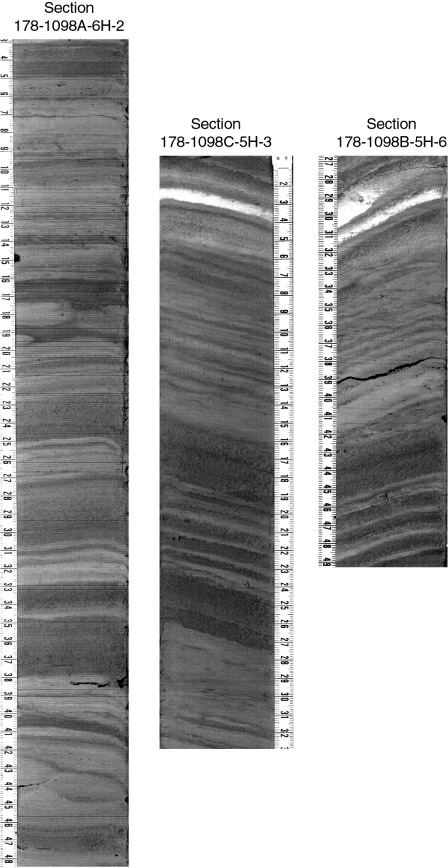
Figure F7. Image data for Holes 1098A, 1098B, and 1098C, corresponding to the interval around 44.1 mcd in Figure F6. Holes 1098B and 1098C show a good correlation in this interval. The interval in Hole 1098A represents the best-guess correlation but shows a different pattern of lamination. Note that images are a gray-scale translation of the original color files and that contrast and brightness are enhanced.
![]()