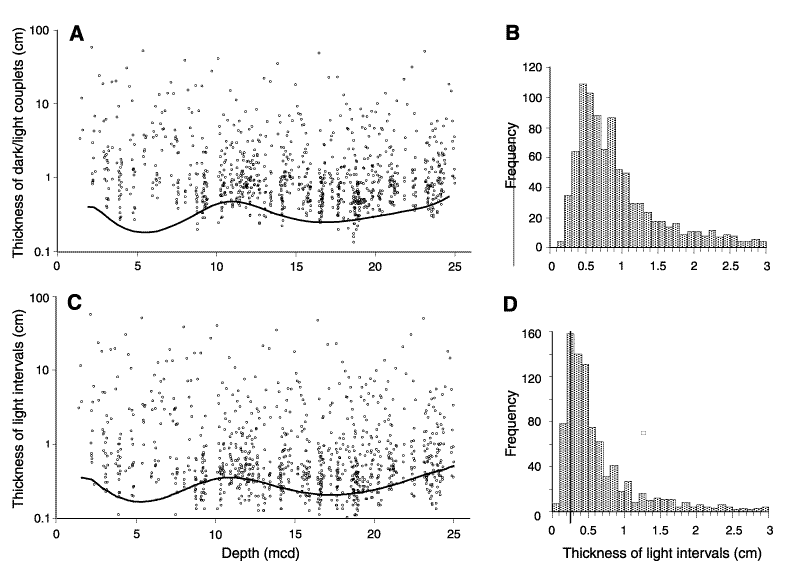
Figure F8.
Thicknesses of dark/light couplets and light intervals compared to long-term average sediment accumulation rates. A. Thickness of dark/light couplets in the spliced record of Figure F3,
against composite depth, with total sediment accumulation rates derived from a ninth-degree polynomial fitted to the radiocarbon data of Domack et al. (in press). Note that dark/light couplets include sediment intervals between dark laminae separated by bioturbated sediments. B. Histogram of data in A, showing couplets  3 cm only; the thick dark line represents the linear average of sedimentation rates. C. Thicknesses of light-colored laminae and intervals only, with sedimentation rates as in A recalculated after subtraction of all dark laminae. D. Histogram of data in C, with linear average accumulation rate for light sediments.

![]()