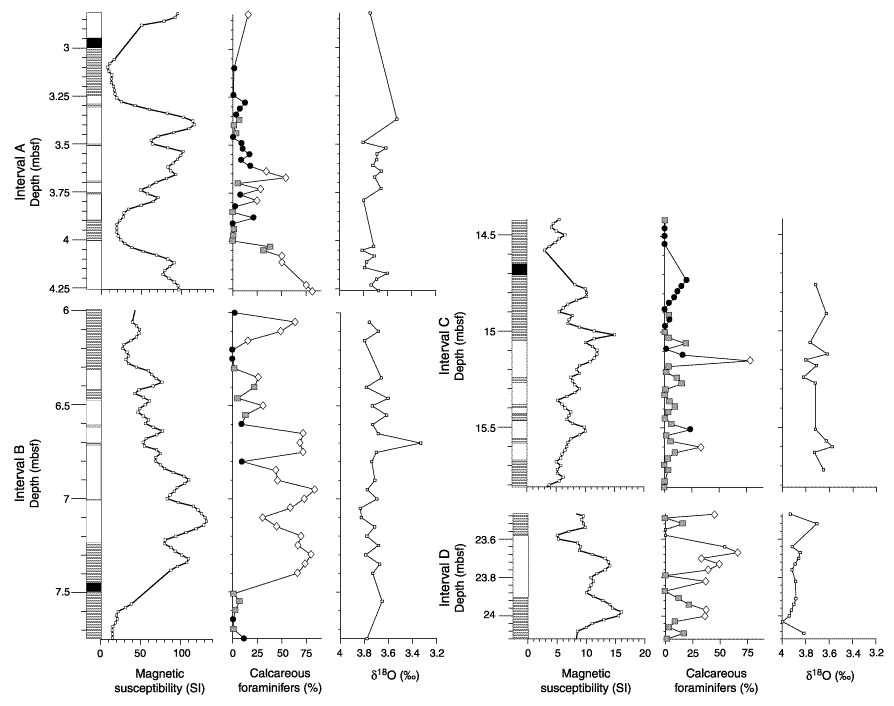
Figure F6.
Magnetic susceptibility, calcareous foraminifers, and  18O results from the four core intervals. On depth axes: lines = laminations, white = bioturbated sediments, and black = the missing 5-cm core interval removed for interstitial water samples at the bottom of each core section. Each left column shows the shipboard magnetic susceptibility measured at 2-cm intervals. The center column shows the percent of total benthic foraminifer fauna composed of calcareous foraminifers (Tables
T4, T5,
T6, T7). Also shown on the center column are the results of Q-mode cluster analysis of 125 samples (Table
T1). Cluster 1 = squares, cluster 2 = circles, cluster 3 = diamonds. Three samples (small squares) included in the calcareous percentage curve of interval D were not included in the cluster analysis due to low numbers. The column on the far right shows the
 18O values of Bulimina aculeata.

![]()