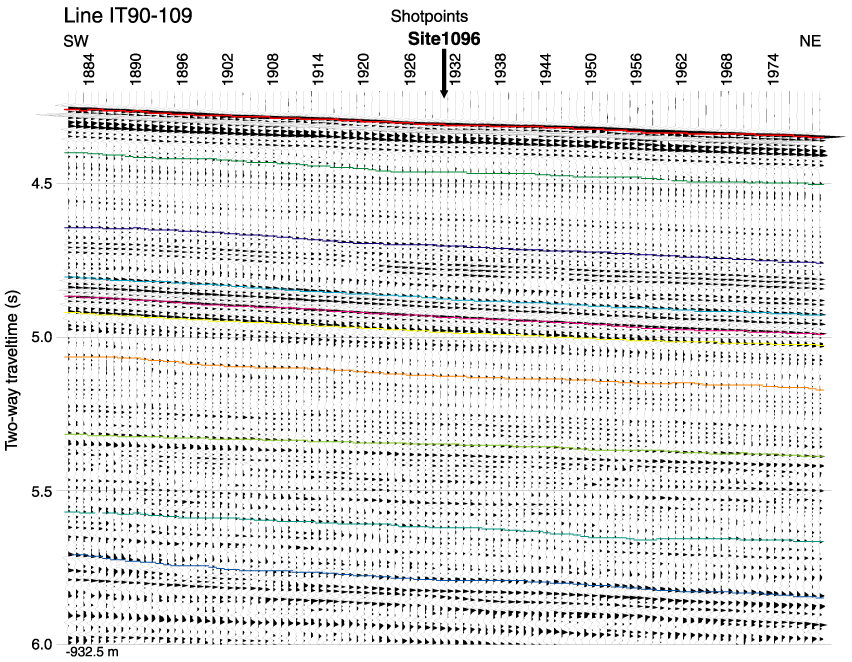
Figure F4. Picking of reflectors for the tomographic inversion of traveltimes at Site 1095. The diagram shows a display of shots as recorded by one trace 932.5 m from the source (see approximate location in Fig. F1). Solid lines indicate the picked horizons. At the end of the inversion, each interval between picked horizons will be identified with a tomographic interval velocity (see Fig. F8).
![]()