![]() Figures F1-F9
Figures F1-F9
![]() Tables
T1-T3
Tables
T1-T3
F1. Location map of sites drilled during ODP Leg 178.
F2. Depth-converted multichannel seismic reflection profile.
F3. Lithofacies of core sections.
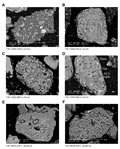
F4. Backscattered electron photomicrographs of grains mounted with epoxy resin.
F5. Total alkali vs. silica classification diagram.
F6. Age release and Ca/K and Cl/K spectra.
F7. Age release spectra of small fractions.
F8. Three-isotope correlation diagrams.
F9. Histograms of age.
T1. Electron microprobe data on groundmass glasses.
T2. 40Ar-39Ar data on milligram-sized fractions.
T3. 40Ar-39Ar data on multigrain fractions.
![]() Figures F1-F9
Figures F1-F9
![]() Tables T1-T3
Tables T1-T3